Adjusting to the new version of Pylab and Mayavi on Ubuntu 12.04

It seems the IPython and Pylab packages has also been updated in 12.04 and thus removing the old ipython -wthread flag that would ensure Mayavi plots to be run in a separate thread. Running with the flag causes this error to show up:

[TerminalIPythonApp] Unrecognized flag: '-wthread'

Without this flag, the Mayavi plots lock up the UI and hangs. If you want to get the possibility back to rotate and play around with the plots, just start IPython the following way from now on:

ipython --pylab=qt

This will launch IPython with the Qt backend and threading. Using only –pylab does not include threading. For easy and quick access, add the following to a file named .bashrc in your home folder:

alias pylab='ipython --pylab=qt'

From now on you can launch IPython just by typing

pylab

in a terminal.

Using the same script on installs with different EPD versions

In the newest version of Enthought’s Python Distribution (EPD) on Ubuntu, the plotting package has been moved from enthought.mayavi.mlab to the shorter and more general mayavi.mlab. This does however mean that if you, like me, need to work with different versions of EPD on multiple systems, will experience the following error from time to time:

ImportError: No module named enthought.mayavi.mlab

Now, to avoid switching the import statement every time you switch systems, you can make Python check if one of the versions is installed during import. If it is not, we’ll tell it to try the other. This is done in this simple command:

try:
    from enthought.mayavi.mlab import *
except ImportError:
    from mayavi.mlab import *

Just replace any other similar import statements the same way and your code should once again be working across all your installations.

The beauty of Mayavi

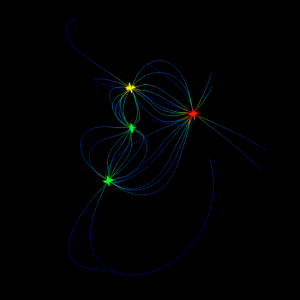
Four charges with different magnitude plotted in 3D using Mayavi

In one of my earlier posts about Mayavi, I wrote about how you could visualize 2D field line plots using the flow function. At the end of that post I added that Mayavi is actually best at 3D plotting, and to follow up on that I’ll show you some of these plots with a few example Python scripts you might try out on your own.

First of all, you might want to know how to install Mayavi. For those lucky ones of you who have freed yourself and jumped on the Linux bandwagon, installing Mayavi should be quite easy. If you are using Ubuntu in particular, you may just install the package mayavi2 using either Synaptic or apt-get. If you are on Windows or Mac, you may either install Enthought’s own Python distribution (EPD) or give a shot at compiling on your own. Just note that EPD is quite expensive, even though all its components are open source, but if you are a student or academic user you could go ahead and download the academic version for free. It is basically the same as the commercial one, but with an academic license. (Kudos to Enthought for both making Mayavi open source, building an business model around it and still providing a great solution for students!)

Now, Enter 3D!

The way you do your plots in Mayavi depends on what you want to express. Most likely, you would prefer to show some simple plots giving just the necessary amount of information to tell you how the electric field behaves around your charges. A simple example of this is shown below:

Continue reading

Using Mayavi to visualize electric fields

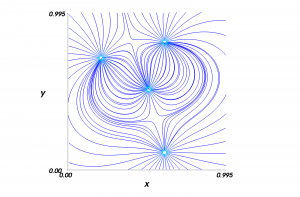
Mayavi renders great field line plots.

While searching for a good Python module to visualize electric fields, I found Mayavi. Developed by Enthought, Mayavi is a very good module for visualizing a huge range of different scientific data sets. Everything from surfaces, flows and streamlines to bar charts, 3D plots and contour surfs are beautifully drawn on screen and exported to several file formats, such as PDF, PNG, EPS and more.

What I needed it for, however, was to visualize electric field lines in the course FYS1120 at the University of Oslo. We were told to use Matlab with the streamline and quiver functions, but even so, I wanted to use Python and decided to do a search and see if something similar was possible with Python. It took me some time to figure out how to use the scitools package to do streamline plots, but eventually I made it. However, these were a bit tedious to get working correctly and looked only about as good as the Matlab plots.

Continue reading

Using Python in the first MAT1120 oblig

The first “oblig” (mandatory exercise) in the subject MAT1120 is now available. I am trying to do as much work as possible in Python instead of Matlab, but as always this creates some extra effort when the subject is oriented around the latter.

Already in the first exercise there is a minor challenge, since the data file is not stored as a simple array, but as Matlab code. This means we need to rewrite this file to Python code or run it in Matlab and export it as data instead. As I am currently using a computer without Matlab installed and being to lazy to connect to a server with Matlab via remote desktop, I decided to do the latter. (I might add that I also wanted to see if I could do this without Matlab at all).

First of all, I figured the data was stored in the following manner:

Continue reading