This guide will be extended during the semester. First out are some instructions on how to play around with Python and MayaVi. We will add more to this guide as we move along to new topics and different methods to perform things.
Before you get started, you need to follow the instructions on how to install Python and MayaVi.
Drawing a simple vector field
The first thing we’ll do is to draw a simple vector field from a point charge. Create a file named vectorfield.py and save it somewhere on your computer.
Add the following to the file, see the comments for details:
from numpy import *
try:
    from mayavi.mlab import *
except ImportError:
    from enthought.mayavi.mlab import *
# this creates a 3D grid which is ranges from -100 to 100 in all
# coordinates, with intersections at every 20th value
# (-100, -80, -60, ...). See 'help mgrid' for details.
x,y,z = mgrid[-100.:101.:20., -100.:101.:20., -100.:101.:20.]
# We will now store the coordinates of our charge as a
# vector. All vectors in Python should be stored as arrays.
# Note that we are placing this charge in between the grid points.
# This is to get the best possible symmetry in this specific field
# If you place the charge _on_ the grid, you get a division of zero
# when calculating the E-field.
qpos = array([10.,10.,10.])
# the magnitude of our charge. This could be any number
# at the moment.
qcharge = 1.0
# Create a grid for the electric field. This has the size of
# x,y and z, but all the values are now set to zero.
Ex, Ey, Ez = x*0, y*0, z*0

# Calculate the x, y and z distance to the charge at every point in the grid:
rx = x - qpos[0]
ry = y - qpos[1]
rz = z - qpos[2]

# Calculate the distance at every point in the grid:
r = sqrt(rx**2 + ry**2 + rz**2)

# Calculate the field for each component at every point in the grid:
Ex = (qcharge / r**2) * (rx / r)
Ey = (qcharge / r**2) * (ry / r)
Ez = (qcharge / r**2) * (rz / r)

# Draw the vector field in 3D
quiver3d(x,y,z,Ex,Ey,Ez)
Open up a terminal and change directory to the same place as your saved file. If you are running Windows, open up Start > Enthought > PyLab and use cd to change directory from there. (Do not use IDLE if you’re on Windows. It does not work well with Mayavi.)
We recommend using IPython in this course. Using IPython gives you the possibility to run Python scripts and continue working on the data from the script without editing the files. In addition you get a lot of other nice features that you can read more about on this page.
If you are using Windows you already have PyLab open (this is IPython), otherwise type the following to open up an IPython session:
ipython --pylab
(If you are running Ubuntu, use ipython -wthread instead.)
Run the file by typing:
%run vectorfield.py
Wow! That should create a cool looking figure like the one below:
 Use the mouse to move around in the figure:
- Left click to rotate.
- Right click, scroll or Ctrl + left click to zoom.
- Middle click or Shift + left click to pan.
As most things in 3D, this looks really cool, but might not be as when you want to read out specific properties of a field. Then it could be much more useful to see the field in 2D with axes and labels.
Edit the file above to have only two dimensions by changing the x,y,z-line to
x,y,z = mgrid[-100.:101.:20., -100.:101.:20., 0.:1.:1.]
And place the charge in the xy-plane:
qpos = array([10.,10.,0])
This will leave us with a 2D plot. Try running the file again by typing:
%run vectorfield.py
You should end up with something like this:
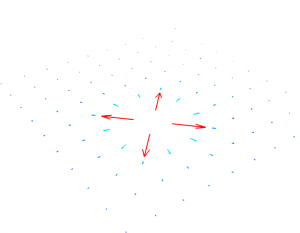 This looks much better, but it is far from publication-ready. We need axes, labels and getting rid of that 3D view. First out, click the Z-button to look down the z-axis:
That should rid us of the 3D view:
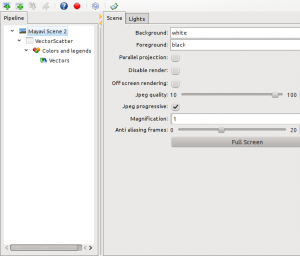
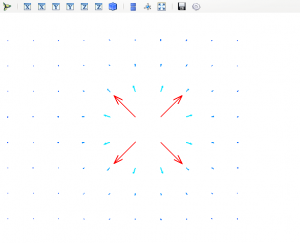 You might notice that the background color changed since the first image. This is found under the Mayavi Pipeline:
Select the color you prefer (black and white works out best) under the Scene properties:
Now, we need to move on with the axes. You can do the following steps either directly in IPython by typing the commands as we go, or save them in the vectorfield.py file and run the file from IPython.
To add axes, just use the following command:
myaxes = axes()
This should give you something like this:
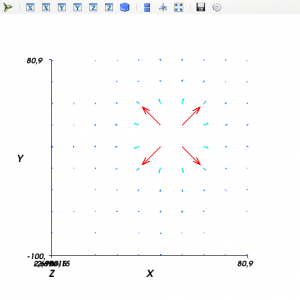 The default axes include the z-axis even though we want to do a 2D plot. To avoid this you can change the axes object in the Mayavi Pipeline:
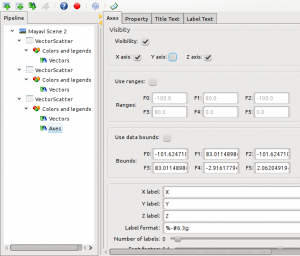 Or you could simply do this programmatically:
myaxes.axes.y_axis_visibility = False
Note that in both cases, the z-axis has been named y. It is beyond me why Mayavi does it this way, but it is easy to figure out what axis to disable by looking at the effect.
Under Title text and Label text you may also change the font used on the labels. Personally I prefer the Times font without bold or italic for the labels and Times with italic only for the titles.
In addition, we’d probably like to have a title for our plot. This may be added by typing:
mytitle = title("My vector field")
You can also add this by right-clicking VectorScatter in the Mayavi Pipeline and selecting Add Module > Text. Afterwards you’ll have to adjust the size and positioning to your needs.
My final render looks like this:
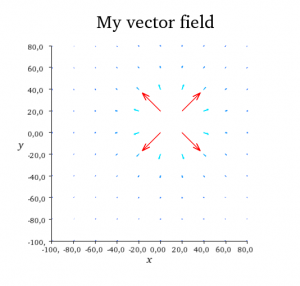 Don’t be sorry if your render is not exactly the same. There are many ways to do this and you should play with the settings until your are happy. If you are having problems with anything, don’t hesitate to contact us or leave a comment on this page.
To save the render as an image, click the save icon in the Mayavi window.
How to learn more
If you want to know more about any of the functions, you can open up ipython, import the necessary packages and type
help(functionname)
to get more info about the function “functionname”. If you for example want to know more about mgrid, you can open up IPython and type the following:
from numpy import *
help(mgrid)
Type Q to exit help mode.


Pingback: Test | Elektromagnetisme
I epd-7.3-2 på OSX er syntaksen for help endret fra
help mgrid
til
help(mgrid)
Det ser ut til å være en syntax som fungerer i tidligere versjoner også, så jeg har endret eksempelet over 😉
Pingback: Mathematical warm-up | Elektromagnetisme
Hvorfor vektlegges Python og Matlab fremfor Mathematica? Selv synes jeg Mathematica er et alt-i-ett program hvor man kan skrive korte koder for å gjøre mye mer uten masse knotete koding. Jeg har egentlig lyst til å gå vekk fra matlab og python til fordel for Mathematica, men er dette lurt?
Dette er et spørsmål som kan bygge opp til et langt svar, men jeg skal prøve å fatte meg i korthet. Selv har jeg ikke hatt så mye erfaring med Mathematica, så du må nok også ta mine innspill med en klype salt. Mye av det jeg kjenner til kommer via annenhånds kilder, deriblant diskusjoner på nettet, og jeg er en Python-fan som foretrekker programvare basert på åpen kildekode. 🙂
De viktigste argumentene for Python er for meg personlig at
Når det gjelder bruken av programvaren virker det for meg som at
Selv om Python på noen områder ikke kan måle seg med Mathematica finnes det også områder det Mathematica blekner i forhold til mulighetene i Python. Jeg anbefaler deg å sjekke ut Sage hvis du er ute etter lignende funksjonalitet som i Mathematica for Python.
Så svaret på spørsmålet ditt om du bør gå over til Mathematica er fra min side nei. Prøv utforske hvordan du kan utnytte Python til det du trenger. Har du behov for å løse likninger kjapt eller plotte avanserte funksjoner på få linjer kan du bruke Mathematica til det, men så snart du har behov for finkontroll er nok Python enklere i bruk.
En annen fordel er at du nå har muligheten til å lære deg Python og samtidig få hjelp i denne prosessen. 😉
Takk for reflektert svar!
Jeg har et spørsmål om Python:
Er det noen måte å få laget subplots med Python på samme måte som med Matlab?
For eksempel et 4×4 plott?
Hvis du bruker matplotlib til å lage 2D plot, så kan du gjøre det med funksjonen subplot:
http://matplotlib.sourceforge.net/api/pyplot_api.html#matplotlib.pyplot.subplot
Med Mayavi ser det dessverre dårlig ut med subplots.
“(If you are running Windows, open up Start > Enthought > PyLab and) use cd to change directory from there.”
Hvordan gjør man egentlig dette? Har tidligere bare brukt IDLE
type “cd ?” in pylab (without the quotation marks)
Hei, beklager et litt sent svar. Hvis du vet hvor du har lagret fila kan du bruke “cd [navnet på mappa]” til å bytte til mappa du har lagret fila i.
F.eks:
dersom fila ligger i mappa C:\Users\Username\Documents\Fys1120\
1) Hva er grunnen til at man i Mayavi ikke får en enorm vektor i origo? Punktet er vel med i gitteret (?) og ladningen ligger like i nærheten. med komponentene av *enhetsvektoren*
  , i.e.
  etc. Det virker det ikke som denne koden gjør (?)
2) Når man finner komponentene til feltet må man multiplisere absoluttverdien
3) Disse kodeeksemplene stiller matplotlib i et latterlig dårlig lys, men det er kanskje meningen?
4) Blir man vant til at x = mgrid[0:1:.1] returnerer [0 .1 .2 .3 .4 .5 .6 .7 .8 .9] (og altså ikke det siste punktet 1)? Vet dere grunnen?
Takk for innspill, Jørgen!
1) Oops! Det var en feil i koden. Jeg stusset over at det gikk så bra som det gjorde. Feilen er den du oppdaget: regnes ut.
2) Stemmer. Koden ble skrevet i hastverk for å gi en innføring i Mayavi. Dessverre falt fysikken ut i farta. Eksempelet er rettet nå og gjort litt tydeligere for å vise hvordan hver komponent av
3) Poenget var å vise at det finnes andre alternativer. Jeg rakk dessverre ikke lage et penere eksempel for matplotlib. Med rettingene til programmet ble plottet desto mindre pent, så da tenker jeg vi utelater matplotlib i denne omgang 😉
4) Det er nok en sammenheng med Pythons range og Numpys arange funksjon. Skriver du arange(0,1,.1) får du også [0, 1, 2, 3, 4, 5, 6, 7, 8, 9]. Jeg mistenker at de har forsøkt å beholde en form for konsistens. Selv om det sikkert hadde vært bedre å ta med det siste ytterpunktet. Jeg har oppdatert koden slik at dette likevel blir med nå (ved å gå til 101 istedenfor 100).
Pingback: Week 1 – Vectors and vector fields | Mindseye