Electric field lines

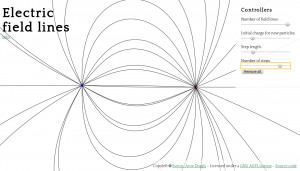
We have made a small demo that will allow you to play around with electric field lines in your web browser. You can place and move around charged particles to see how the field changes as you make your own charge configuration.

An electric field line simulator straight in your browser!

Try the simulator here

Note that there are some limitations to this simulation, leaving it a bit unphysical when it comes to lines that might end up in open space, wrong field line density and other quirks. All in all it should be correct to a decent approximation, though.

For the programming enthusiasts out there, the simulation is created using Javascript and HTML5. You can check out the source code here.

Enjoy!

Using Mayavi to visualize electric fields

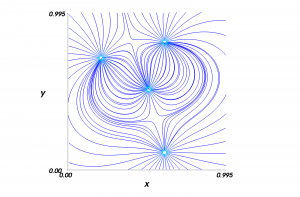
Mayavi renders great field line plots.

While searching for a good Python module to visualize electric fields, I found Mayavi. Developed by Enthought, Mayavi is a very good module for visualizing a huge range of different scientific data sets. Everything from surfaces, flows and streamlines to bar charts, 3D plots and contour surfs are beautifully drawn on screen and exported to several file formats, such as PDF, PNG, EPS and more.

What I needed it for, however, was to visualize electric field lines in the course FYS1120 at the University of Oslo. We were told to use Matlab with the streamline and quiver functions, but even so, I wanted to use Python and decided to do a search and see if something similar was possible with Python. It took me some time to figure out how to use the scitools package to do streamline plots, but eventually I made it. However, these were a bit tedious to get working correctly and looked only about as good as the Matlab plots.

Continue reading