Animating plots and waves in Python using matplotlib

matplotlib is an amazing framework to do visual plots in Python. It compares well with GnuPlot and beats Matlab’s plotting abilities by having more features. Although it does lack some 3D support, you may simply choose a different framework for 3D plots thanks to Python’s flexibility . In which case I would recommend Mayavi as a superb 3D plotting engine which I have written about before.

But now, let’s have a look at matplotlib’s animation capabilities. The script below shows a very easy approach to animation in matplotlib. This results in an animation of the standing wave shown here:

The script is as follows:
Continue reading

Using Mayavi to visualize electric fields

Mayavi renders great field line plots.

While searching for a good Python module to visualize electric fields, I found Mayavi. Developed by Enthought, Mayavi is a very good module for visualizing a huge range of different scientific data sets. Everything from surfaces, flows and streamlines to bar charts, 3D plots and contour surfs are beautifully drawn on screen and exported to several file formats, such as PDF, PNG, EPS and more.

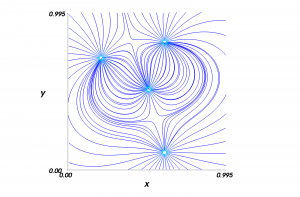
What I needed it for, however, was to visualize electric field lines in the course FYS1120 at the University of Oslo. We were told to use Matlab with the streamline and quiver functions, but even so, I wanted to use Python and decided to do a search and see if something similar was possible with Python. It took me some time to figure out how to use the scitools package to do streamline plots, but eventually I made it. However, these were a bit tedious to get working correctly and looked only about as good as the Matlab plots.

Continue reading

Using Python in the first MAT1120 oblig

The first “oblig” (mandatory exercise) in the subject MAT1120 is now available. I am trying to do as much work as possible in Python instead of Matlab, but as always this creates some extra effort when the subject is oriented around the latter.

Already in the first exercise there is a minor challenge, since the data file is not stored as a simple array, but as Matlab code. This means we need to rewrite this file to Python code or run it in Matlab and export it as data instead. As I am currently using a computer without Matlab installed and being to lazy to connect to a server with Matlab via remote desktop, I decided to do the latter. (I might add that I also wanted to see if I could do this without Matlab at all).

First of all, I figured the data was stored in the following manner:

Continue reading